Taking a fresh look at Mercer’s Geographic Salary Differential tool
Are you fielding more and more questions from employees and managers on how pay is determined? Pay transparency legislation has shined a spotlight on the topic, putting pressure on employers to get their ducks in a row when it comes to compensation. Many compensation teams are reviewing their benchmark methodologies, survey selections, and market pricing practices to make sure everything is in line, especially when employees are located in different geographic areas.
What is a geographic pay differential?
A geographic pay differential is a measurement of how much the cost of labor varies from one location to another. A geographic differential - typically expressed as a percentage - indicates how much the cost of labor varies between two locations or between a location and the national median.
For example, if you compare Las Vegas, Nevada to the national average, you will find that the geographic differential for Las Vegas is on average 3%. This means that Las Vegas has a cost of labor that is 3% higher than the national median, or 103% of the national average.
While the cost of living is taken into consideration when determining geographic pay differentials, the cost of labor for that area is what is truly used to assess the overall competitiveness of a particular location in terms of attracting and retaining talent.
Using geographic differentials
There are a couple of common ways that you might use geographic differentials in your compensation administration and design work. Most commonly, geographic differentials are used to modify national salary survey data and to create geographically differentiated salary bands or ranges.
Adjusting salary survey data
When you look at salary survey data for jobs, one of the choices you make is whether to look at the national data (meaning all the data across the country averaged together) versus data for a specific city, town, or metropolitan area. If you choose to use data for a specific geographic location, you are limiting the number of responses (i.e., reducing the sample size). Typically, you will also be filtering the data by specific variables such as industry, which further reduces the sample size. I’m sure you know what can happen because of all this filtering — the sample is so small that you no longer see the data points you are looking for. To avoid that issue, it`s better to view the national cut of the salary data. You can still select other modifiers, like industry, and then use geographic pay differentials to adjust the national data. For example, say you target the median, or fiftieth percentile, for base salary for all your jobs. The table below shows how you might adjust the national data by applying a geographic differential for New York City, NY and Cincinnati OH.
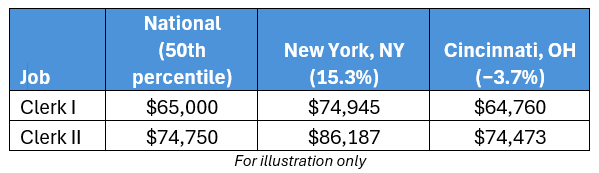
This approach not only ensures a larger sample size, but also is more efficient because it allows you to pull just the national salary data cut and then apply a geographic differentials, rather than pull from multiple geographic locations.
Creating geographic zones or ranges
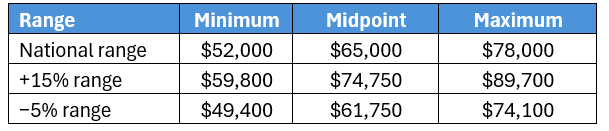
Another way geographic differentials are used is to create variations in your base salary structure to account for areas that have a significantly higher or lower cost of labor. For example, using the data above, if you priced all your jobs using the national median, you would then do a regression analysis to create a “national,” or base salary structure. Next, you would take all your locations and, using the geographic differential, group them by like differentials and assign them to structures with the appropriate cost of labor adjustments.
That would mean that a Clerk I, with a national market composite of $65,000, would be placed in the “national range” (shown in the table below). However, the same job would be put in the +15% range for New York, NY and the −5% range for Cincinnati, OH.
How are geographic differentials developed?
Geographic pay differentials are based on cost of labor. To determine the cost of labor, you want to look at how much pay is actually allocated to jobs in each location. Mercer does this for you by taking the data that HR professionals submit to us annually through Mercer Data Connector and calculating the differences in pay from one location to the next. It’s as simple as that. This reflects the cost of labor because it’s what employers have been able to pay employees to fill their jobs. The data you use to market price your jobs — trusted data taken from surveys like Mercer Benchmark Database, which has gone through our multipoint quality assurance process - is the same data we use to calculate the geographic pay differentials.
As with your salary surveys, it’s important to understand where the data in your geographic differentials database/survey comes from. If you are using a source that is less than transparent about their methodology and source list, then ask questions.
When relying on a source of geographic pay differentials, you want to be confident that the data are not employee provided or even sources from other publicly available records. While employee-provided and crowd-sources data have their place, they are not the best source when determining geographic differentials.
If you trust Mercer for your salary surveys, it’s safe to say you can trust our Geographic Differential tool and, of course, they are efficiencies to be gained when leveraging data from a single provider.
Is Mercer’s Geographic Salary Differential Tool right for you?
With over 5,200 locations representing over 20 million data points in the US, Mercer’s Geographic Differential tool could be just what you need. Whether you are looking to increase your market pricing efficiency, or to have a reliable source for assigning locations to salary structures, Mercer’s tool is one you can trust.
Have questions about the Geographic Differential Tool? We have colleagues ready to help. Call 1-855-286-5302 or email us for sample data and additional information to help you decide if this tool is right for you.