When market pricing your jobs with salary surveys, it’s important that you have a consistent approach for addressing anomalies in the data that you find, whether using traditional surveys or crowd-sourced data.

After you have confirmed the survey positions that you will use to market price your job by doing a review of the job’s responsibilities and position description in the survey, it’s time to look at the data and identify any anomalies or data issues.
In this article, we will cover different data anomalies that you may encounter while market pricing jobs and options for addressing them.
Common data anomalies
When you collect data from multiple salary surveys to develop a composite to market price a jobs, you expect to see data points that are similar. But what happens when there is a significant gap from one survey to another? For example, one survey says that the job in consideration has a median pay of $56,800 while another survey says $72,400 – what?? How should you handle that data outlier?
Let’s take a look at various ways to address data anomalies such as this.

Example 1: Data points that don’t “hang” with the others
In this example, each data point reflects the base salary at the 50th percentile.
Each data point reflects the base salary at the 50th percentile.
Survey 1 shows the base salary is $67,000.
Survey 2 shows the base salary is $70,000.
Survey 3 shows the base salary is $120,000.
As you can see, the data point from survey 3 is significantly different than that from 1 and 2. So, what should you do?
First, double-check all the data from survey 3, starting with the number of observations and organizations. If either number looks small (e.g., less than 100 observations or less than 10 companies), discard the data point. If any other numbers seem off (i.e. The Target Total Cash Compensation is lower than the base salary) then consider discarding it as well.
Next, reconsider whether the survey job description accurately reflects the job in your organization. If you are satisfied with the match, then perhaps it’s just ‟bad data.” It happens for a variety of reasons and it’s important not to include it in the composite.

Example 2: Inconsistencies within job families
For this example, let’s say that you’ve been asked to market price three jobs of differing levels within one job family – Accountant I, Accountant III, and Sr Accountant. You are reviewing the base salary data at the 60th percentile. Within one survey, the data doesn’t follow the progression you would expect. The value for the mid-level job, Accountant III, is lower than that for Accountant I.
Accountant I = $65,000
Accountant III = $64,000
Sr. Accountant = $74,000
Don’t panic, there are a few things you can do.
Don’t make the mistake of assuming the levels in the survey match your levels. Re-examine the job descriptions of both your jobs as well as the survey position descriptions. Your job ladder in that family might start higher or lower than what’s reflected in the survey. Make sure that your job and the survey position description match based on responsibilities and qualifications and adjust as necessary by adding premiums or discounts or by selecting different matches.
Just like in the last example, you’ll take a look at the observations and organization count for that Accountant III match. It could be that there weren’t enough observations reported, and the average is being influenced by a low payer with multiple incumbents. In that case, you could switch to company-weighted data, assuming you’re currently looking at incumbent-weighted data.
Finally, assuming you have additional data points from other surveys for that same job, discard this data point and move on. In most cases, you’ll be positioning the jobs within a salary structure, which will ensure there is a logical progression.
Creating composites
Once you are satisfied with the multiple survey data points for each job, you should figure out how to combine the different survey data points to develop a market rate composite for each job. (The specific rules, or method, for building composites will be determined and documented when developing your benchmark methodology.)
Data modifiers
There are three types of modifiers that you can apply to the survey data to modify the value and how it contributes to the market rate composite.
The first is the aging factor. Aging survey data is a regular practice used to bring disparate survey effective dates to a common point. (This is different than taking surveys from the prior year, applying an aging factor to bring them forward, making them ‘current’ for this year. That’s no longer a suggested practice due to the volatility amongst different jobs.)
All surveys have an effective date that represents the point in time when the data was collected from participants. Because those effective dates vary, your data might reflect salaries from different times in the performance year (e.g., pre or post-merit increase).
Another modifier was referenced above — the weight you apply to a line of data. If you have a line of data point that you do not want included in the composite, then you would weight it zero. If you have a line of data that you want to contribute more than others to the composite, you will weight it more heavily.
But, why would you make these adjustments? Let’s look at a few reasons:
- Perhaps one of the surveys is an industry-specific survey that better reflects your labor market competitors and you want to weight that more heavily in your composite.
- Or perhaps you want a survey to contribute less to the composite because they have a reputation for always reporting lower salaries due to a high amount of not-for-profit participants.
Tip:
Your salary benchmark methodology should explain how and why you apply premiums, discounts, and weights to ensure they are applied consistently as you market price jobs
In either case, you might weight that data differently (see below), resulting in a slightly different composite.
Finally, there are premiums and discounts that you apply to the data in order to reflect differences in the matching. For example, the survey job might be a slightly smaller job – meaning less responsibilities, than the job you are comparing, so you’d want to add a premium to the data (e.g., 110% or 1.10).
Take a look at this example:
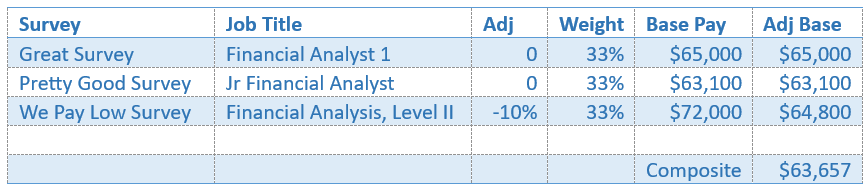
You can see that we have three data sources above. The third one, “Financial Analysis, Level II” has a 10% discount taken from the job because the responsibilities are just a bit higher than those in our organization's Financial Analyst job. That discount results in a reduced base salary that will contribute to the composite. You see now that each survey is weighted equally at 33%. This indicates that we don’t value any of these surveys more or less than the other and want them all to contribute equally to the composite. Each of the adjusted base values (“Adj Base”) is multiplied by the weight and then added together to create the composite.
One example of when you would apply differing weights to survey data is when you want to have a particular survey more significantly influence the composite.
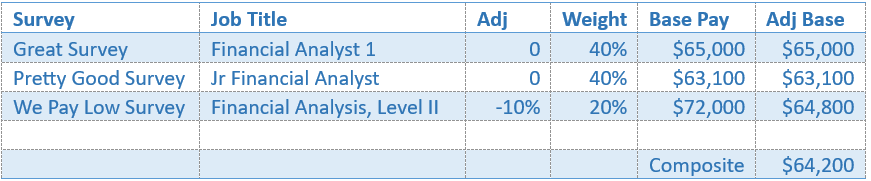
Truthfully, it’s less about the difference that weighting makes in the composite than it is about the discipline of carefully considering the data and survey source, utilizing a methodology to market price jobs, and documenting it all. When it comes to presenting your findings to hiring managers, you’ll want to have that degree of certainty in your back pocket.
There’s a lot that goes into ensuring effective, accurate, and consistent market pricing of your jobs. Mercer is here to help! Reach out to one of our associates at surveys@mercer.com or call us at 1-855-286-5302.
Here are some additional resources that you might find helpful from our Compensation 101 Series.